Turning a cross-border product launch into one operating model
A specialist healthcare distributor was preparing a new local operation for imported clinical products. An existing model and a separate sales forecast needed to become one expandable planning tool for product economics, field sales, payroll, financing and management reporting.
Supplier price and import cost remain separate so product margin can be tested rather than assumed.
The operation can plan in its working currency while management reads a translated reporting view.
Salary, commission, benefits and locally required employment costs follow the operating cadence.
Commercial output is measured against the field team that is expected to create it.
WHY THIS WASN’T A TEMPLATE EXERCISE
The model had to respect
how the business actually moved.
The reconstructed architecture connects every product family from purchase and import cost through units sold, commercial support and representative productivity, then translates the local operation into a separate management-reporting view.
Margin began before a product reached the warehouse
A single cost-per-unit assumption would hide the difference between the supplier price and the cost of bringing each product into the local market.
Compensation was part of the sales engine
Monthly salary, commission basis, bonuses, benefits and statutory employment charges all changed the cost of building a field-sales team.
One launch needed several management lenses
Product-category performance, representative productivity, financing and translated outputs had to reconcile to the same underlying forecast rather than live in separate files.
MODEL ARCHITECTURE
From operating activity
to a decision-ready view.
Each layer has one job. Together they keep the commercial story, unit economics and cash consequences on the same timeline.
Expandable product architecture
Each product and category receives its own price, volume and commercial assumptions while the structure remains open to future additions.
Sales and category mix
Unit demand, selling price and commercial support build revenue by product family and show how the mix changes over time.
Landed cost bridge
Supplier cost and import-related cost are calculated separately per unit before rolling into category COGS and gross margin.
Field-team economics
Representative headcount, monthly compensation and commission logic connect payroll cost to revenue and units sold per rep.
Operating-cost structure
Fixed and variable expenses are categorized consistently so the dashboard can explain which activities support each product family.
Financing and reporting
Loan proceeds, principal repayment and interest feed the cash forecast, while one control layer produces local and translated outputs.
WHAT THE ANALYSIS SURFACED
Useful answers,
without exposing client data.
The takeaways are intentionally qualitative. Exact assumptions, calculations and outputs remain inside the confidential client model.
Purchase price alone did not explain product margin
Keeping import cost visible by unit makes it possible to see which product families remain attractive after they arrive in the operating market.
Growth and sales-force productivity needed the same chart
Revenue can rise because the team grows, because each representative sells more or because the product mix changes. Reporting revenue and units per rep helps distinguish those causes.
A required annual payroll item needed accrual logic
Recognizing the cost across the year prevents its eventual payment month from looking like an unexplained operating shock.
Two reporting currencies should not create two forecasts
A single calculation engine with controlled translation keeps management views comparable and reduces the risk of assumptions drifting between versions.
MODELING APPROACH
The working system
behind the answer.
- Expandable product, category, pricing and unit-sales assumptions
- Supplier-cost and import-cost schedule by product
- Monthly payroll, commission, benefits and employment-cost plan
- Fixed and variable operating-expense structure
- Representative productivity and product-mix reporting
- Loan amount, repayment and interest schedule
- Integrated P&L, cash flow and multi-currency dashboard views
CASE CONFIDENTIALITY
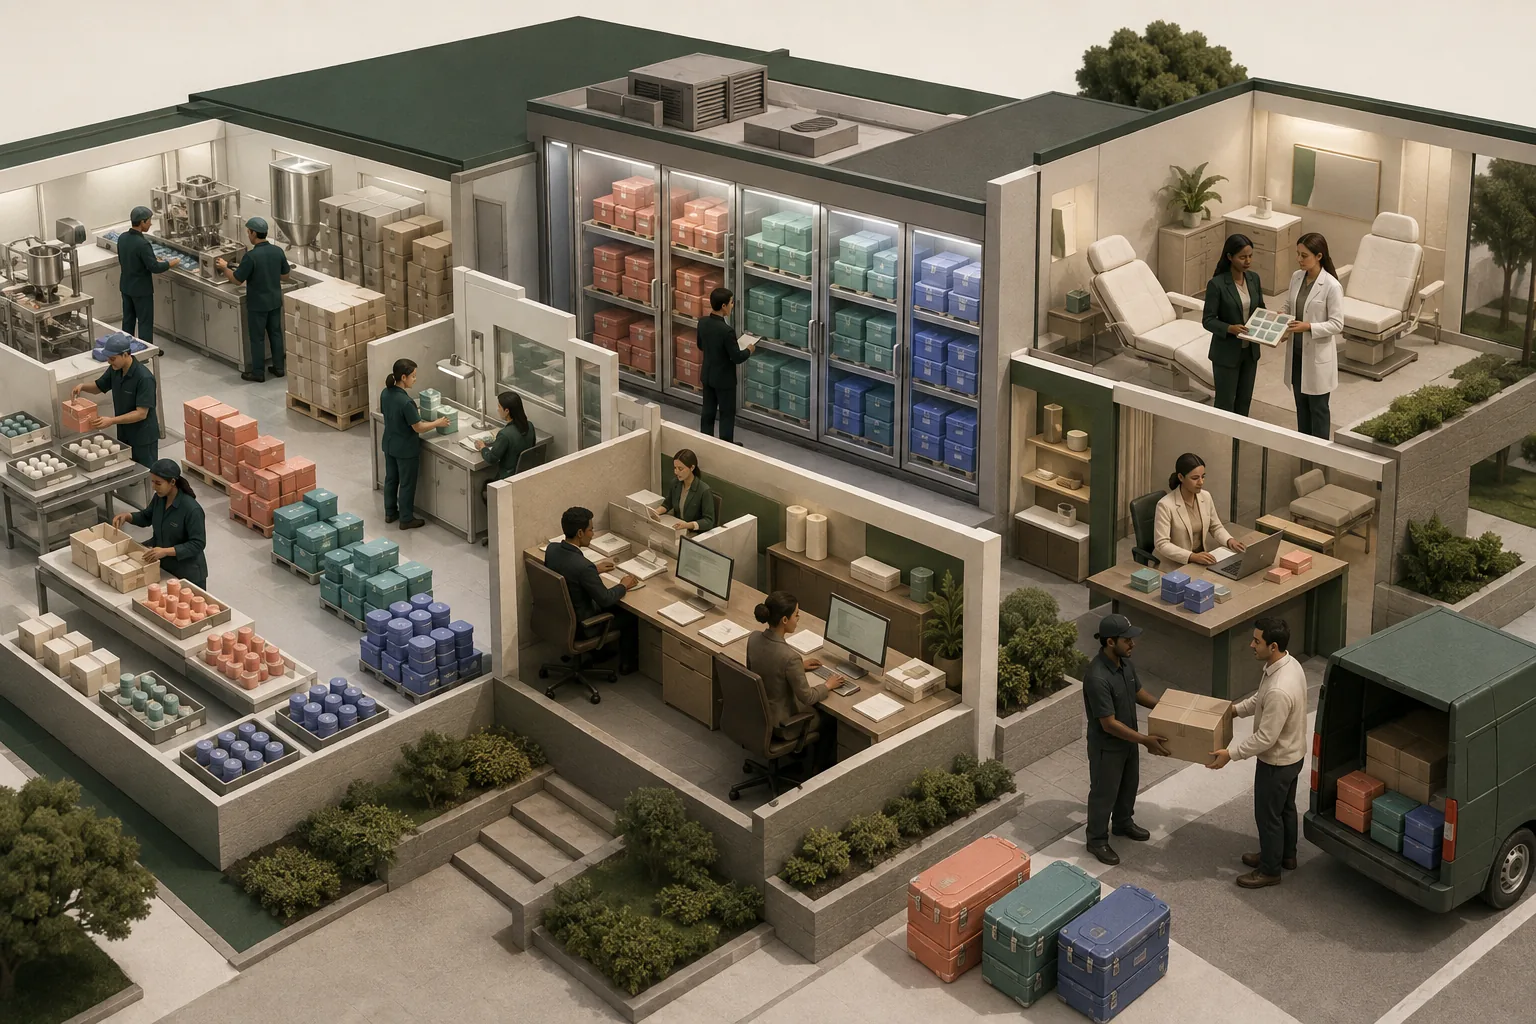
This anonymized case explains the cross-border distribution and model architecture without naming the company, team, suppliers, locations, dates, currencies, product names, product count, prices, volumes, compensation terms, statutory requirements, financing terms or model versions. The source briefs, sales forecast, workbook, formulas, highlighted review status and exact dashboard outputs remain private. The illustration is an original fictional supply chain rather than a real manufacturer, warehouse, clinic, product or client workflow.