Deciding which new market an online grocer could afford to enter
A growing online grocer was comparing prospective urban markets. The team needed a lean operating model that could explain not only how many orders each market might generate, but whether basket margin, picking, staffing and delivery costs could support expansion.
Each market kept its own demand and cost assumptions while sharing one modeling logic.
The operating ramp had to reach a credible positive contribution within the team’s acceptable timeframe.
Basket value, category margin, picking and delivery costs remained visible at order level.
A compact driver structure kept the market comparison explainable and easy to update.
WHY THIS WASN’T A TEMPLATE EXERCISE
The model had to respect
how the business actually moved.
The model separates market-specific demand, category mix, basket economics and cost-to-serve, then reconnects them in a comparable operating result instead of treating topline growth as proof of viability.
Order volume needed a reason to exist
A market-entry forecast could not begin with an unsupported sales total. Orders had to be built from explicit demand assumptions and separated by product category.
Every basket carried a different margin story
Average order value alone was not enough. Category mix and category-specific cost of goods determined how much contribution was available to pay for fulfillment and delivery.
The last mile turned growth into commitments
Wages, vehicle leases and local fixed costs arrived before route density fully matured, so an attractive demand curve could still produce an unattractive operating ramp.
MODEL ARCHITECTURE
From operating activity
to a decision-ready view.
Each layer has one job. Together they keep the commercial story, unit economics and cash consequences on the same timeline.
Market demand
Local assumptions translate into annual order volume by product category rather than one unsupported headline forecast.
Basket and mix
Average order value and category weights convert orders into a market-specific sales build.
Contribution per order
Category cost of goods, picking and other variable expenses show what each basket contributes before fixed delivery infrastructure.
Local operating base
Wages, vehicles and fixed expenses create the cost base that order density must absorb as the market ramps.
Entry decision
Comparable operating results expose the break-even path and the assumptions that make one market more resilient than another.
WHAT THE ANALYSIS SURFACED
Useful answers,
without exposing client data.
The takeaways are intentionally qualitative. Exact assumptions, calculations and outputs remain inside the confidential client model.
Topline growth was not the market-entry test
The useful question was how quickly order contribution could absorb the local picking, staffing, vehicle and delivery base—not simply how large sales might become.
Category mix could move the break-even line
Two baskets with the same selling price can support very different economics when their product margins and handling requirements differ.
A city can win on demand and lose on cost-to-serve
A larger addressable market is not automatically the better launch market if delivery routes, labor and the fixed operating base require materially more contribution per order.
Vehicle capacity behaves in steps, not smooth percentages
Leased vehicles may look like a stable expense, but the next block of route capacity arrives as a discrete commitment. That threshold belongs inside the scenario logic.
MODELING APPROACH
The working system
behind the answer.
- Comparable market input sets and operating summaries
- Order forecast by product category
- Average basket, category mix and cost-of-goods logic
- Variable fulfillment and delivery expense schedule
- Wage, vehicle and fixed-cost build
- Per-order unit economics, EBITDA and break-even views
- Assumption notes and model handover guidance
CASE CONFIDENTIALITY
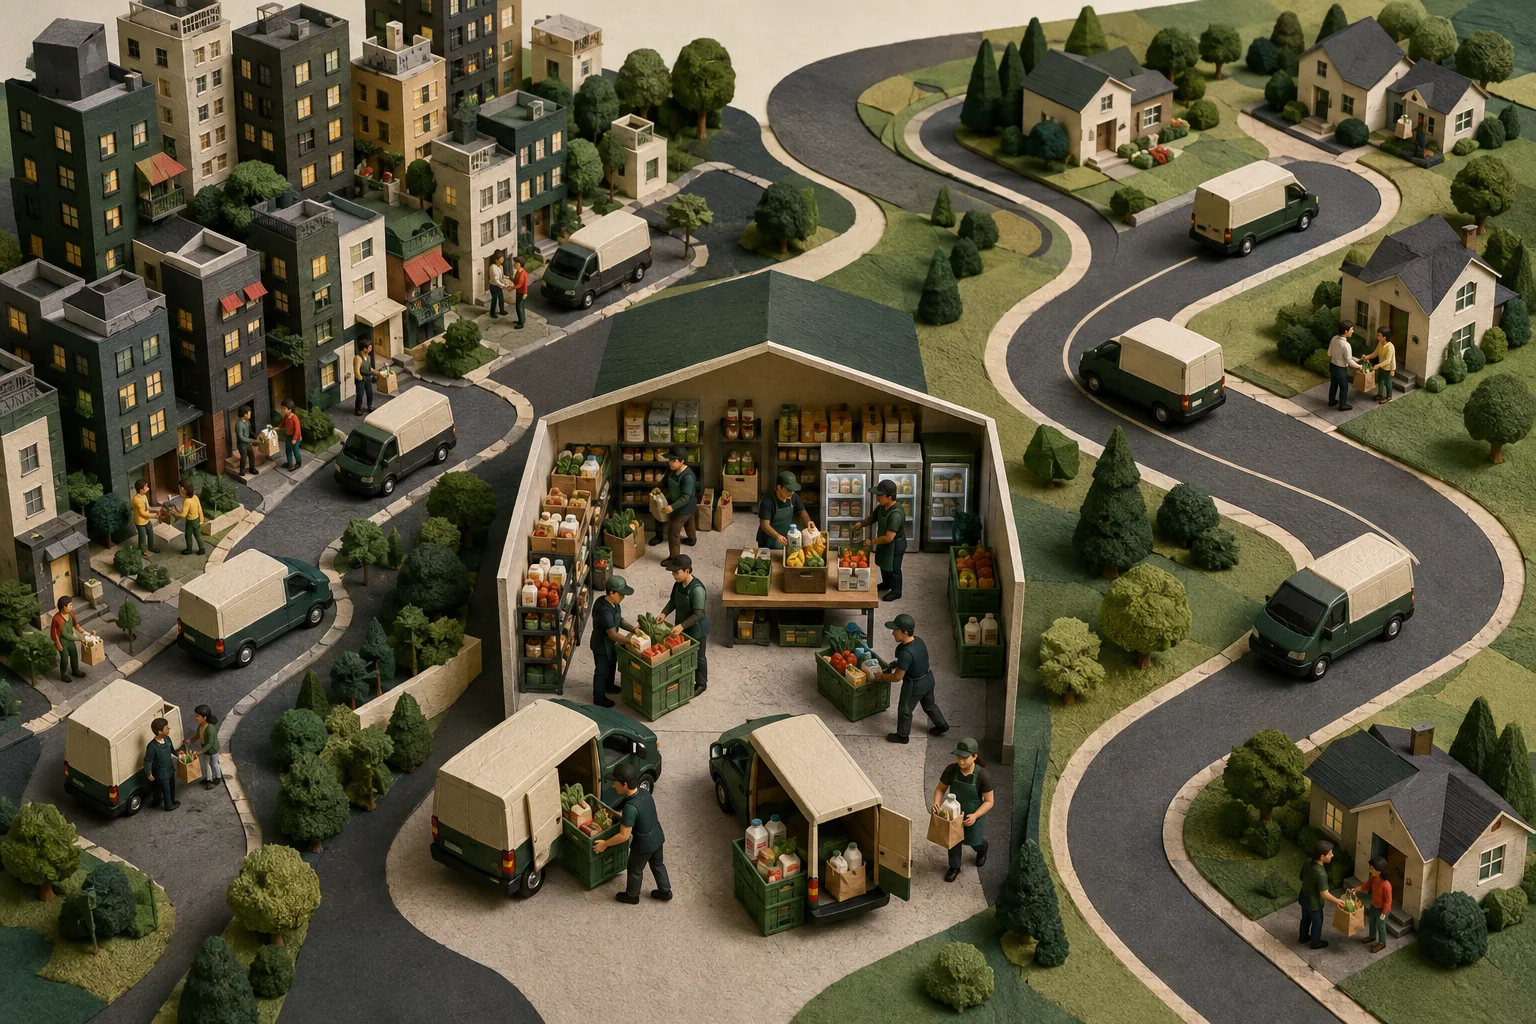
This anonymized case explains the market-entry decision without naming the grocer, target cities or planning thresholds. Exact order assumptions, product economics, staffing inputs and workbook structure remain private. The illustration is an original fictional operating scene rather than a client facility, route map or model screenshot.